May 7, 2013
It all started with a call from Jim Biard’s oldest daughter. Living in Berkeley, California, she had heard about Swarmaggedon and was excited about visiting North Carolina in May with her son, Biard’s grandson, to see the 17-year cicada emergence.
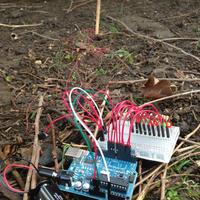
Turns out, Brood II doesn’t extend as far as Biard's home in Asheville. But the DIY cicada kits we designed to monitor the soil temperature, and help predict the arrival of bug hordes along the East Coast this spring, set off a light bulb in Biard's head.
Biard is a research scholar at NOAA’s National Climatic Data Center, which operates the U.S. Climate Reference Network (USCRN). Beginning in 2009, USCRN was fitted with instruments to measure soil temperature to better monitor change in soil climate, and produce drought indicators.
USCRN has 114 stations across the US, and 113 of them collect soil temperature data at 20 centimeters (just a little under 8 inches) below ground -- roughly the same depth necessary to monitor the cicada emergence. Biard realized that feeding the readings from the USCRN stations inside the Brood II emergence zone to our cicada tracker map would give us access to a bunch of extra (super reliable) data points... and help us better gauge when the cicadas would start popping out of the ground. Here's the map -- with temperature readings from USCRN stations and DIY observers (plus we're starting to get reports of actual cicada sightings!):
Biard and his colleagues are also interested in the readings our DIY cicada trackers are sending in, because that data provides a useful comparison for USCRN's readings. Biard says, “being able to have more citizen science involvement with providing more information across the country about other things, such as soil temperature, could be really wonderful.”
Because soil temperature (of course) doesn't just affect cicadas. It has a big impact on humans too. Biard's colleague Dr. Jesse Bell, a research associate at the Cooperative Institute for Climate and Satellites-North Carolina, has been working on connecting soil temperature data to other issues. For example: “Soil temperature can act as a good reference for the start of the growing season,” explained Bell.
Yep, forget the Farmer’s Almanac. Bell, with the assistance of Dr. Jessica Matthews, looks at satellite observations over USCRN stations to measure plant growth in each location. And he compares what he sees with the data collected by the stations -- such as soil, air, and surface temperatures.
That information will help farmers and others decide when the best time to plant is, and how to prepare for each year’s growing season, especially as the climate changes. The data will also give a better understanding of drought indices. As Bell explains, if the soil temperature indicates there should be a green-up, but the satellite images don’t reflect that, that area is “clearly in drought because things don’t line up, and they should.”
Now USCRN is helping cicada enthusiasts (and everyone who'd rather stay indoors when the bugs invade...) know when to expect Brood II in their area. And Biard is excited by this opportunity to engage the public. “If we can find something that excites their imagination and gets them to connect and see and understand the science of climate change, and of awareness of climate in the world, I think it’s cool.”
Even if his grandson won’t witness the emergence in person this May.
If you see or hear cicadas on the East Coast this spring, fill out our quick cicada-spotting form (and we'll send your data to bug scientists who are tracking the emergence).
